


- Explore expert-led tours, events & experiences at low prices
- Book tickets & things to do in popular cities worldwide
- Browse deals by city & theme or search by activities
Vancouver weather by month
Check out Vancouver weather averages by month. Compare detailed monthly climate statistics including temperature, rainfall and sunshine figures.
Temperature in Vancouver (°F)
| Jan | Feb | Mar | Apr | May | Jun | Jul | Aug | Sep | Oct | Nov | Dec | |
|---|---|---|---|---|---|---|---|---|---|---|---|---|
| Max temperature (daytime) |  45 45 |
 50 50 |
 54 54 |
 59 59 |
 66 66 |
 72 72 |
 79 79 |
79 |
73 |
63 |
52 |
45 |
| Min temperature (night-time) |  32 32 |
34 |
37 |
39 |
45 |
50 |
54 |
54 |
48 |
43 |
37 |
34 |
| Heat & Humidity |  0 0 |
0 |
0 |
0 |
0 |
0 |
 L L |
L |
0 |
0 |
0 |
0 |
Note: 0 = None, L = Low, M = Moderate, H = High, VH = Very high, E = Extreme
Sunshine & UV index in Vancouver
| Jan | Feb | Mar | Apr | May | Jun | Jul | Aug | Sep | Oct | Nov | Dec | |
|---|---|---|---|---|---|---|---|---|---|---|---|---|
| Daily hours of sunshine | ||||||||||||
| Daily hours of daylight |  9 9 |
 10 10 |
 12 12 |
 14 14 |
 15 15 |
 16 16 |
15 |
14 |
12 |
 11 11 |
9 |
9 |
| UV Index (Maximum) |  1 1 |
2 |
 3 3 |
5 |
 6 6 |
7 |
 8 8 |
7 |
5 |
3 |
1 |
1 |
Rainfall in Vancouver
| Jan | Feb | Mar | Apr | May | Jun | Jul | Aug | Sep | Oct | Nov | Dec | |
|---|---|---|---|---|---|---|---|---|---|---|---|---|
| Number of days with some rain |  18 18 |
16 |
17 |
 14 14 |
 12 12 |
 9 9 |
 4 4 |
5 |
8 |
12 |
 19 19 |
19 |
| Average monthly rainfall (inches) |  6.4 6.4 |
 4.6 4.6 |
4.2 |
 2.8 2.8 |
 2.2 2.2 |
1.7 |
 0.7 0.7 |
 1.1 1.1 |
1.9 |
 3.3 3.3 |
 6.1 6.1 |
7.0 |
More about Vancouver
Vancouver by month
Jan Feb Mar Apr May Jun Jul Aug Sep Oct Nov Dec
Recommended for Washington State
The climate guide for Washington State (Vancouver) shows long term monthly weather averages processed from data supplied by CRU (University of East Anglia), the Met Office & the Netherlands Meteorological Institute. Find out more about our data sources.
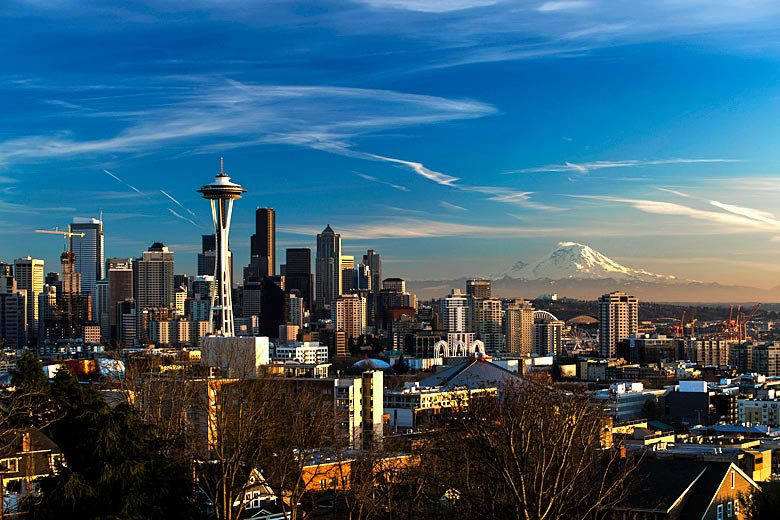
What's the climate like in Vancouver?
Vancouver has a temperate climate with warm dry summers.
Vancouver weather in January
Expect daytime maximum temperatures of 45°F in Vancouver, Washington State in January based on long-term weather averages. There are 3 hours of sunshine per day on average with 18 days with some rainfall and typically 6.4 inches of rainfall in the month.
- 45°F max day temperature45
- 3 hours of sunshine per day
- 18 days with some rainfall18
- 32°F min night temperature32
- 9 hours of daylight per day9
- No heat & humidity0
- 6.4 inches of monthly rainfall6.4
- 1 (Low) UV index1
Vancouver weather in February
Expect daytime maximum temperatures of 50°F in Vancouver, Washington State in February based on long-term weather averages. There are 4 hours of sunshine per day on average with 16 days with some rainfall and typically 4.6 inches of rainfall in the month.
- 50°F max day temperature50
- 4 hours of sunshine per day
- 16 days with some rainfall16
- 34°F min night temperature34
- 10 hours of daylight per day10
- No heat & humidity0
- 4.6 inches of monthly rainfall4.6
- 2 (Low) UV index2
Vancouver weather in March
Expect daytime maximum temperatures of 54°F in Vancouver, Washington State in March based on long-term weather averages. There are 6 hours of sunshine per day on average with 17 days with some rainfall and typically 4.2 inches of rainfall in the month.
- 54°F max day temperature54
- 6 hours of sunshine per day
- 17 days with some rainfall17
- 37°F min night temperature37
- 12 hours of daylight per day12
- No heat & humidity0
- 4.2 inches of monthly rainfall4.2
- 3 (Moderate) UV index3
Vancouver weather in April
Expect daytime maximum temperatures of 59°F in Vancouver, Washington State in April based on long-term weather averages. There are 7 hours of sunshine per day on average with 14 days with some rainfall and typically 2.8 inches of rainfall in the month.
- 59°F max day temperature59
- 7 hours of sunshine per day
- 14 days with some rainfall14
- 39°F min night temperature39
- 14 hours of daylight per day14
- No heat & humidity0
- 2.8 inches of monthly rainfall2.8
- 5 (Moderate) UV index5
Vancouver weather in May
Expect daytime maximum temperatures of 66°F in Vancouver, Washington State in May based on long-term weather averages. There are 9 hours of sunshine per day on average with 12 days with some rainfall and typically 2.2 inches of rainfall in the month.
- 66°F max day temperature66
- 9 hours of sunshine per day
- 12 days with some rainfall12
- 45°F min night temperature45
- 15 hours of daylight per day15
- No heat & humidity0
- 2.2 inches of monthly rainfall2.2
- 6 (High) UV index6
Vancouver weather in June
Expect daytime maximum temperatures of 72°F in Vancouver, Washington State in June based on long-term weather averages. There are 10 hours of sunshine per day on average with typically 1.7 inches of rainfall in the month.
- 72°F max day temperature72
- 10 hours of sunshine per day
- 9 days with some rainfall9
- 50°F min night temperature50
- 16 hours of daylight per day16
- No heat & humidity0
- 1.7 inches of monthly rainfall1.7
- 7 (High) UV index7
Vancouver weather in July
Expect daytime maximum temperatures of 79°F in Vancouver, Washington State in July based on long-term weather averages. There are 11 hours of sunshine per day on average.
- 79°F max day temperature79
- 11 hours of sunshine per day
- 4 days with some rainfall4
- 54°F min night temperature54
- 15 hours of daylight per day15
- Low heat & humidityL
- 0.7 inches of monthly rainfall0.7
- 8 (Very High) UV index8
Vancouver weather in August
Expect daytime maximum temperatures of 79°F in Vancouver, Washington State in August based on long-term weather averages. There are 10 hours of sunshine per day on average.
- 79°F max day temperature79
- 10 hours of sunshine per day
- 5 days with some rainfall5
- 54°F min night temperature54
- 14 hours of daylight per day14
- Low heat & humidityL
- 1.1 inches of monthly rainfall1.1
- 7 (High) UV index7
Vancouver weather in September
Expect daytime maximum temperatures of 73°F in Vancouver, Washington State in September based on long-term weather averages. There are 8 hours of sunshine per day on average with typically 1.9 inches of rainfall in the month.
- 73°F max day temperature73
- 8 hours of sunshine per day
- 8 days with some rainfall8
- 48°F min night temperature48
- 12 hours of daylight per day12
- No heat & humidity0
- 1.9 inches of monthly rainfall1.9
- 5 (Moderate) UV index5
Vancouver weather in October
Expect daytime maximum temperatures of 63°F in Vancouver, Washington State in October based on long-term weather averages. There are 5 hours of sunshine per day on average with 12 days with some rainfall and typically 3.3 inches of rainfall in the month.
- 63°F max day temperature63
- 5 hours of sunshine per day
- 12 days with some rainfall12
- 43°F min night temperature43
- 11 hours of daylight per day11
- No heat & humidity0
- 3.3 inches of monthly rainfall3.3
- 3 (Moderate) UV index3
Vancouver weather in November
Expect daytime maximum temperatures of 52°F in Vancouver, Washington State in November based on long-term weather averages. There are 3 hours of sunshine per day on average with 19 days with some rainfall and typically 6.1 inches of rainfall in the month.
- 52°F max day temperature52
- 3 hours of sunshine per day
- 19 days with some rainfall19
- 37°F min night temperature37
- 9 hours of daylight per day9
- No heat & humidity0
- 6.1 inches of monthly rainfall6.1
- 1 (Low) UV index1
Vancouver weather in December
Expect daytime maximum temperatures of 45°F in Vancouver, Washington State in December based on long-term weather averages. There are 2 hours of sunshine per day on average with 19 days with some rainfall and typically 7.0 inches of rainfall in the month.
- 45°F max day temperature45
- 2 hours of sunshine per day
- 19 days with some rainfall19
- 34°F min night temperature34
- 9 hours of daylight per day9
- No heat & humidity0
- 7.0 inches of monthly rainfall7.0
- 1 (Low) UV index1
More about Vancouver
Vancouver by month
Jan Feb Mar Apr May Jun Jul Aug Sep Oct Nov Dec
Recommended for Washington State
- Explore expert-led tours, events & experiences at low prices
- Book tickets & things to do in popular cities worldwide
- Browse deals by city & theme or search by activities
The climate guide for Washington State (Vancouver) shows long term monthly weather averages processed from data supplied by CRU (University of East Anglia), the Met Office & the Netherlands Meteorological Institute. Find out more about our data sources.
Compare Vancouver weather with the UK
The weather chart below compares the average monthly maximum daytime temperature for Vancouver, Washington, USA and the UK (London).
Maximum daytime temperature (°F)
Vancouver, Washington, USA
UK (London)
Jan
Feb
Mar
Apr
May
Jun
Jul
Aug
Sep
Oct
Nov
Dec
Metric (°C) | Imperial (°F)
More about the USA
Be inspired
Get your weekly fix of holiday inspiration from some of the world's best travel writers plus save on your next trip with the latest exclusive offers
We promise not to share your details
Related posts

Popular travel offers


Explore holiday destinations
- Beach holidays
- City breaks
- Family holidays
- Half term holidays
- Spring holidays
- Summer holidays
- Autumn holidays
- Winter sun holidays
- Honeymoons
- Coolcations
- Compare places
- Ski resorts
Save with latest deals & discounts
- Holiday offers
- Top travel brands
- Airlines & flights
- Discount hotels
- TUI
- Jet2holidays
- Neilson
- Marella Cruises
- Holiday Extras
- Pierre & Vacances
- Caledonian Travel
- Club Med
Airport parking
- Manchester Airport
- Stansted Airport
- Bristol Airport
- Luton Airport
- Birmingham Airport
- Edinburgh Airport
- Gatwick Airport
- Glasgow Airport
- Newcastle Airport
Airport lounges
- Manchester Airport
- Birmingham Airport
- Bristol Airport
- Edinburgh Airport
- Glasgow Airport
- Heathrow Airport
- Newcastle Airport
- Stansted Airport
- Gatwick Airport