


- Book online with TUI & save up to 8% on holidays
- FREE child places available for select holidays
- Pay £0 deposits with direct debit & spread the cost
Best time to visit Mexico's Caribbean Coast
Find the best time to visit Mexico's Caribbean Coast and plan your perfect trip in 2025/2026. Get holiday inspiration, weather guides, travel advice and find great deals.
- Best time to visit

- Weather by month

- 5-day weather forecast

- Destinations

- Travel advice

- Deals & discounts

Mexico - Caribbean Coast by month
Jan Feb Mar Apr May Jun Jul Aug Sep Oct Nov Dec
Recommended for Mexico - Caribbean Coast
 TUI deal finder
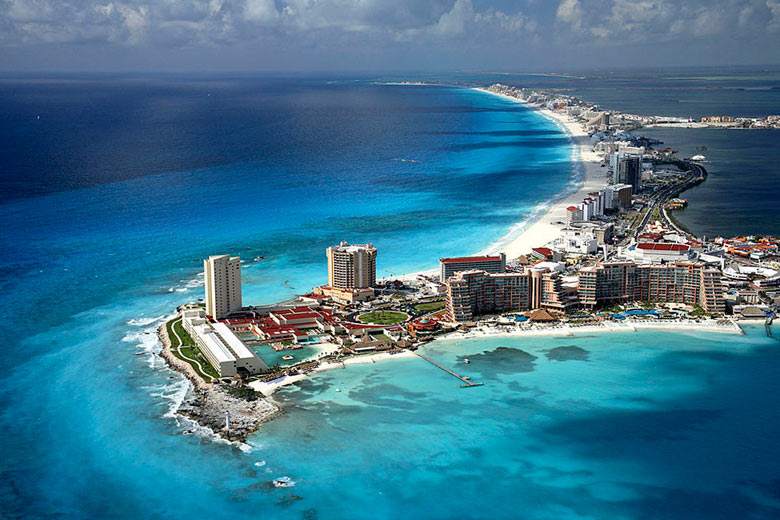
Top Mexico's Caribbean Coast destinations
Below are the temperatures expected today at popular countries, regions and places in Mexico - Caribbean Coast. Select a destination to compare today's forecast with average weather conditions.
All Mexico - Caribbean Coast destinations
- Akumal
- Cancun
- Cozumel
- Isla Mujeres
- Playa del Carmen
- Playa Paraiso
- Playacar
- Puerto Aventuras
- Puerto Morelos
- Tulum
- Xcaret
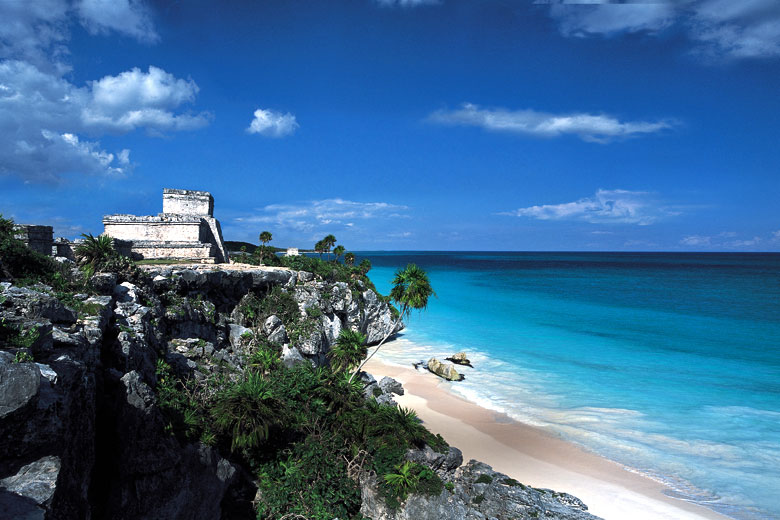
When is the best time to visit Mexico's Caribbean Coast?
The best time to visit Mexico's Caribbean Coast (Cancun) is February based on the following average weather conditions.
Maximum daytime temperature = 22 - 30°C [remove]
Daily hours of sunshine = 10 hours or more [remove]
Change the criteria to reflect your weather preferences.


Max Day Temperature (°C)
- Jan
 28
28 - Feb28
- Mar
 30
30 - Apr32
- May32
- Jun32
- Jul32
- Aug33
- Sep32
- Oct30
- Nov29
- Dec28


Which is the hottest month in Mexico's Caribbean Coast?
The hottest time of year in Cancun, Mexico's Caribbean Coast is normally August. Expect maximum daytime temperatures to reach 33°C with very high heat and humidity.
Which month has the most rain in Mexico's Caribbean Coast?
In terms of rainfall, September is usually the wettest month in Cancun, Mexico's Caribbean Coast with 229mm on average. There are normally 14 days in September with some rain.
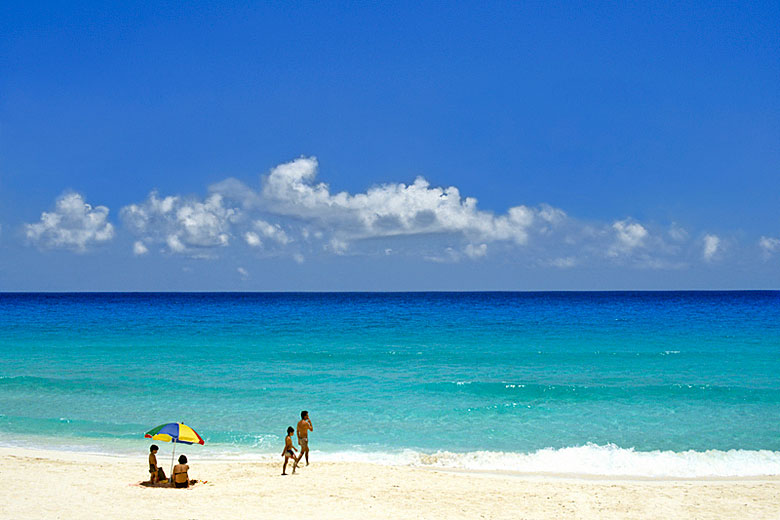
When is it sunniest in Mexico's Caribbean Coast?
The sunniest time of year in Cancun, Mexico's Caribbean Coast is normally April with bright sunshine on average for 63% of daylight hours; that's 8 hours of sunshine per day.
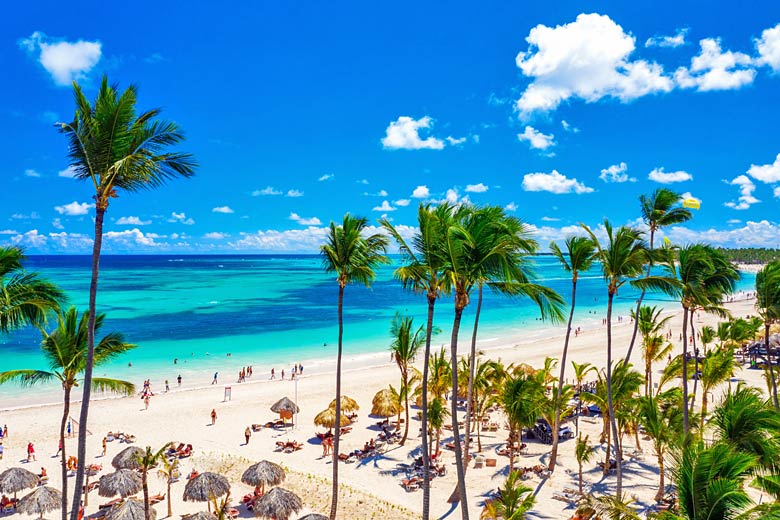
When is the sea warmest in Mexico's Caribbean Coast?
The sea is usually at its warmest in Cancun, Mexico's Caribbean Coast in September when the water temperature reaches 29°C.
Best time to visit
The weather guide for Mexico's Caribbean Coast (Cancun) shows long term weather averages processed from data supplied by CRU (University of East Anglia) & today's weather forecast provided by meteoblue. Find out more about our data sources.
Metric (°C / mm) | Imperial (°F / inches)
Mexico's Caribbean Coast overview

Mexico's Caribbean Coast travel features
Do you want to learn more about Mexico's Caribbean Coast? Read our latest features covering travel tips and insider destination guides on where to go and what to do in Mexico's Caribbean Coast.

Be inspired
Get your weekly fix of holiday inspiration from some of the world's best travel writers plus save on your next trip with the latest exclusive offers
We promise not to share your details
Related posts


Popular travel offers

Explore holidays in the sun for less
- Beach holidays
- Family holidays
- City breaks
- Summer holidays
- Winter sun holidays
- Holiday offers
- Top travel brands
- Airlines & flights
- Discount hotels
- Airport parking deals
- TUI
- Jet2holidays
- easyJet holidays
- Love Holidays
- January sales
Airport parking
- Manchester Airport
- Stansted Airport
- Bristol Airport
- Luton Airport
- Birmingham Airport
- Edinburgh Airport
- Gatwick Airport
- Glasgow Airport
- Newcastle Airport
Airport lounges
- Manchester Airport
- Birmingham Airport
- Bristol Airport
- Edinburgh Airport
- Glasgow Airport
- Heathrow Airport
- Newcastle Airport
- Stansted Airport
- Gatwick Airport